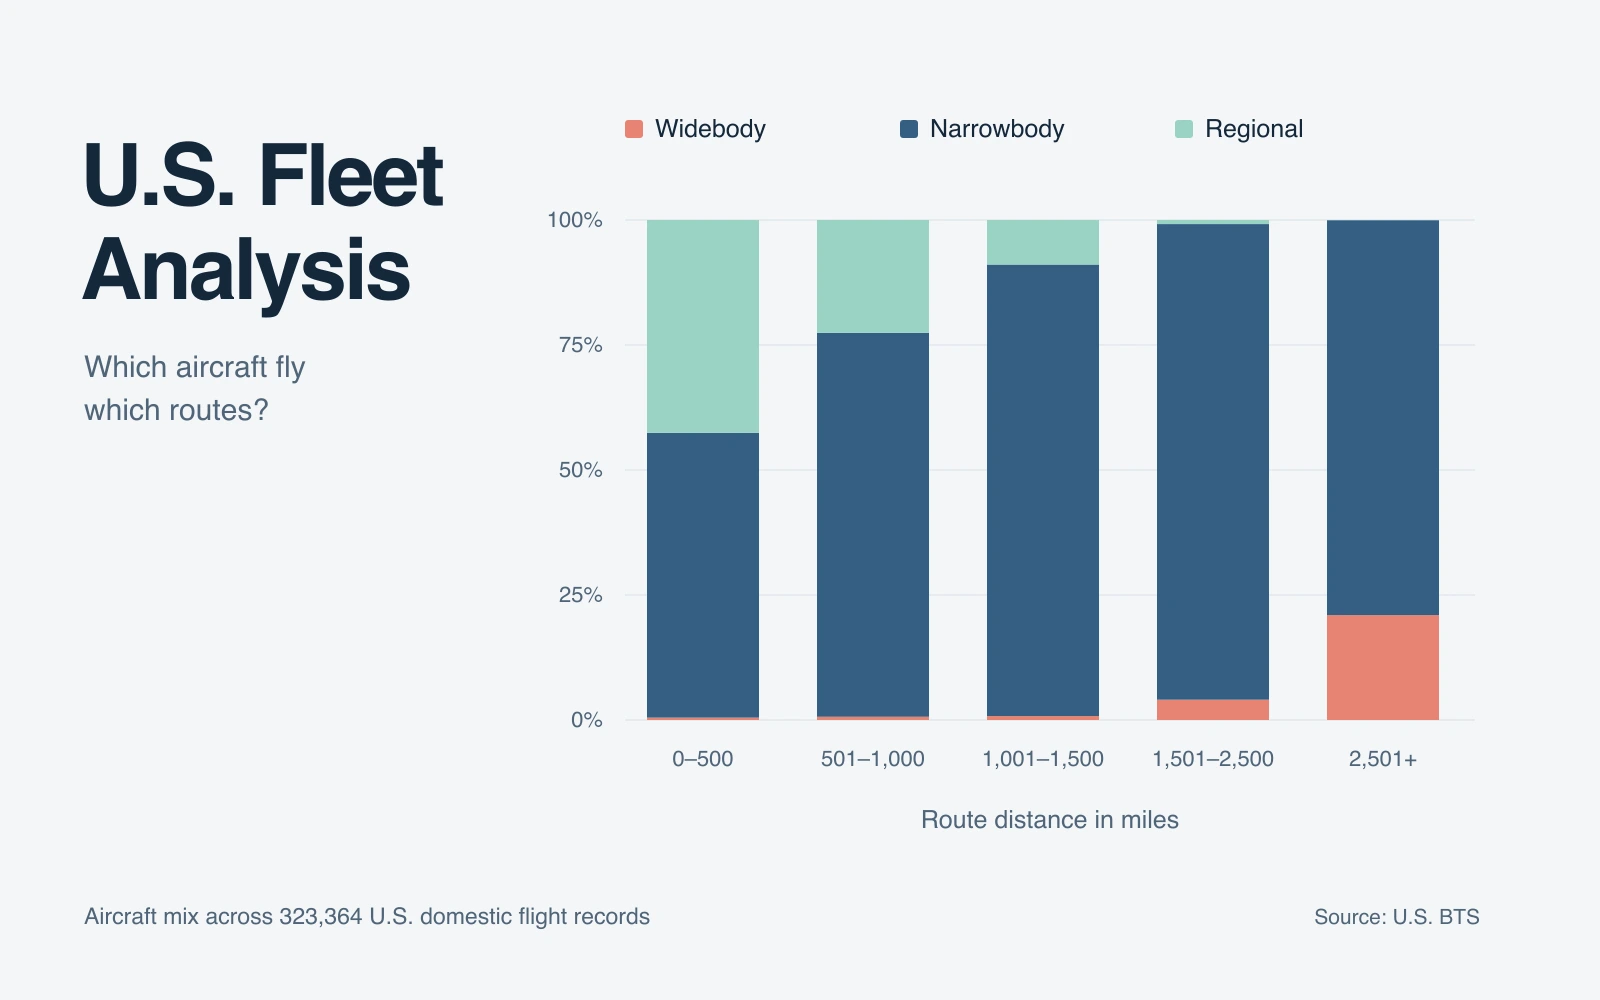
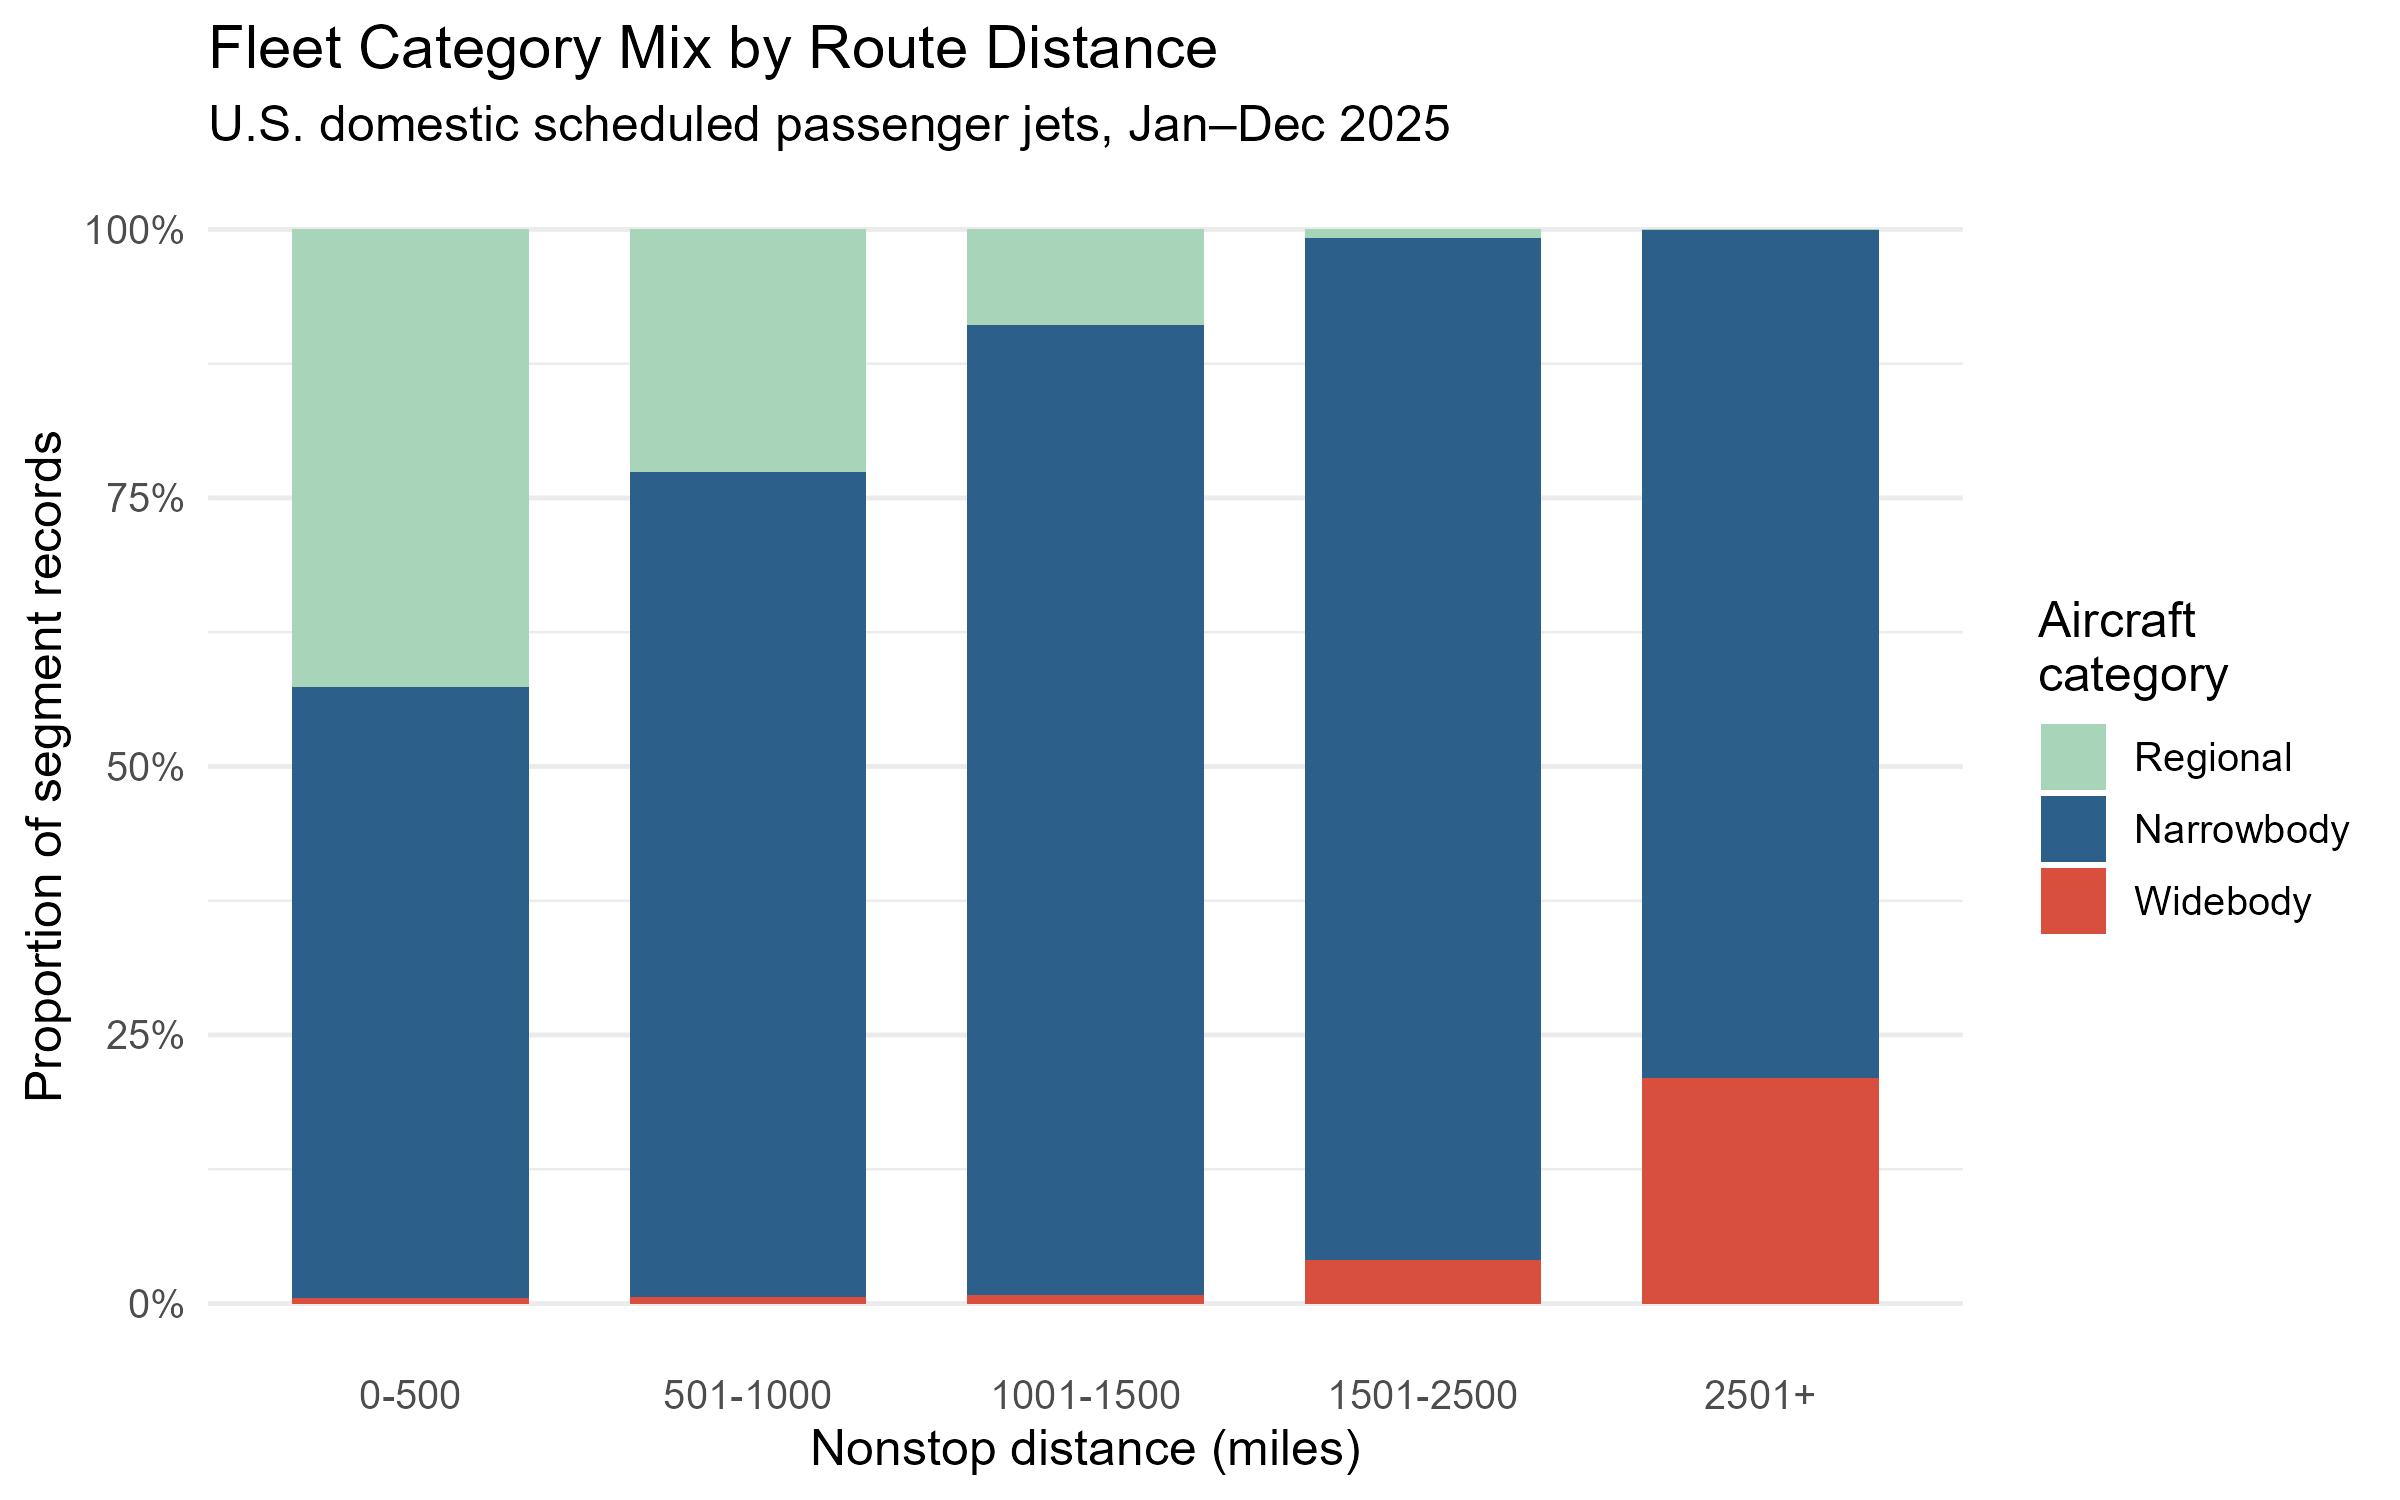
This R study examines how aircraft mix changes with route distance across the United States, and how to sample it accurately. It uses 2025 BTS T-100 domestic data, covering 323,364 segment records across 13,720 directional routes. The proportions describe those records, not counts of individual aircraft.
Where widebodies appear
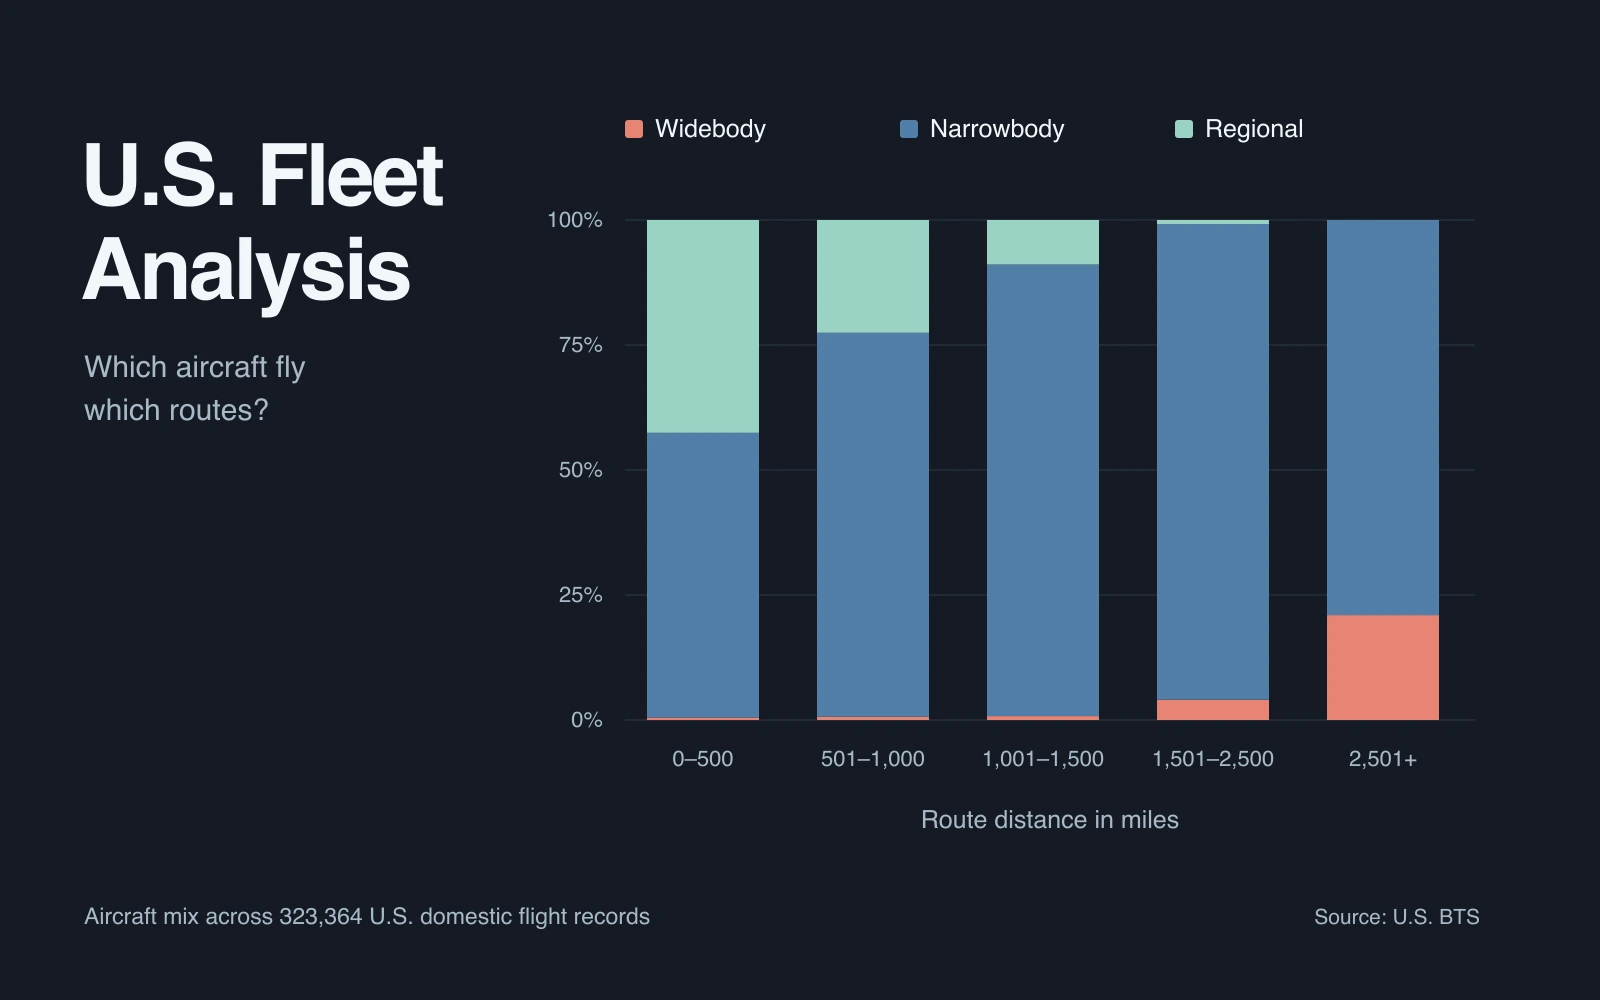
Across five distance bands, widebody share rises from less than 1% on short routes to about 21% beyond 2,500 miles. That uneven distribution matters when drawing a small sample to estimate widebody use.
Compare sampling methods
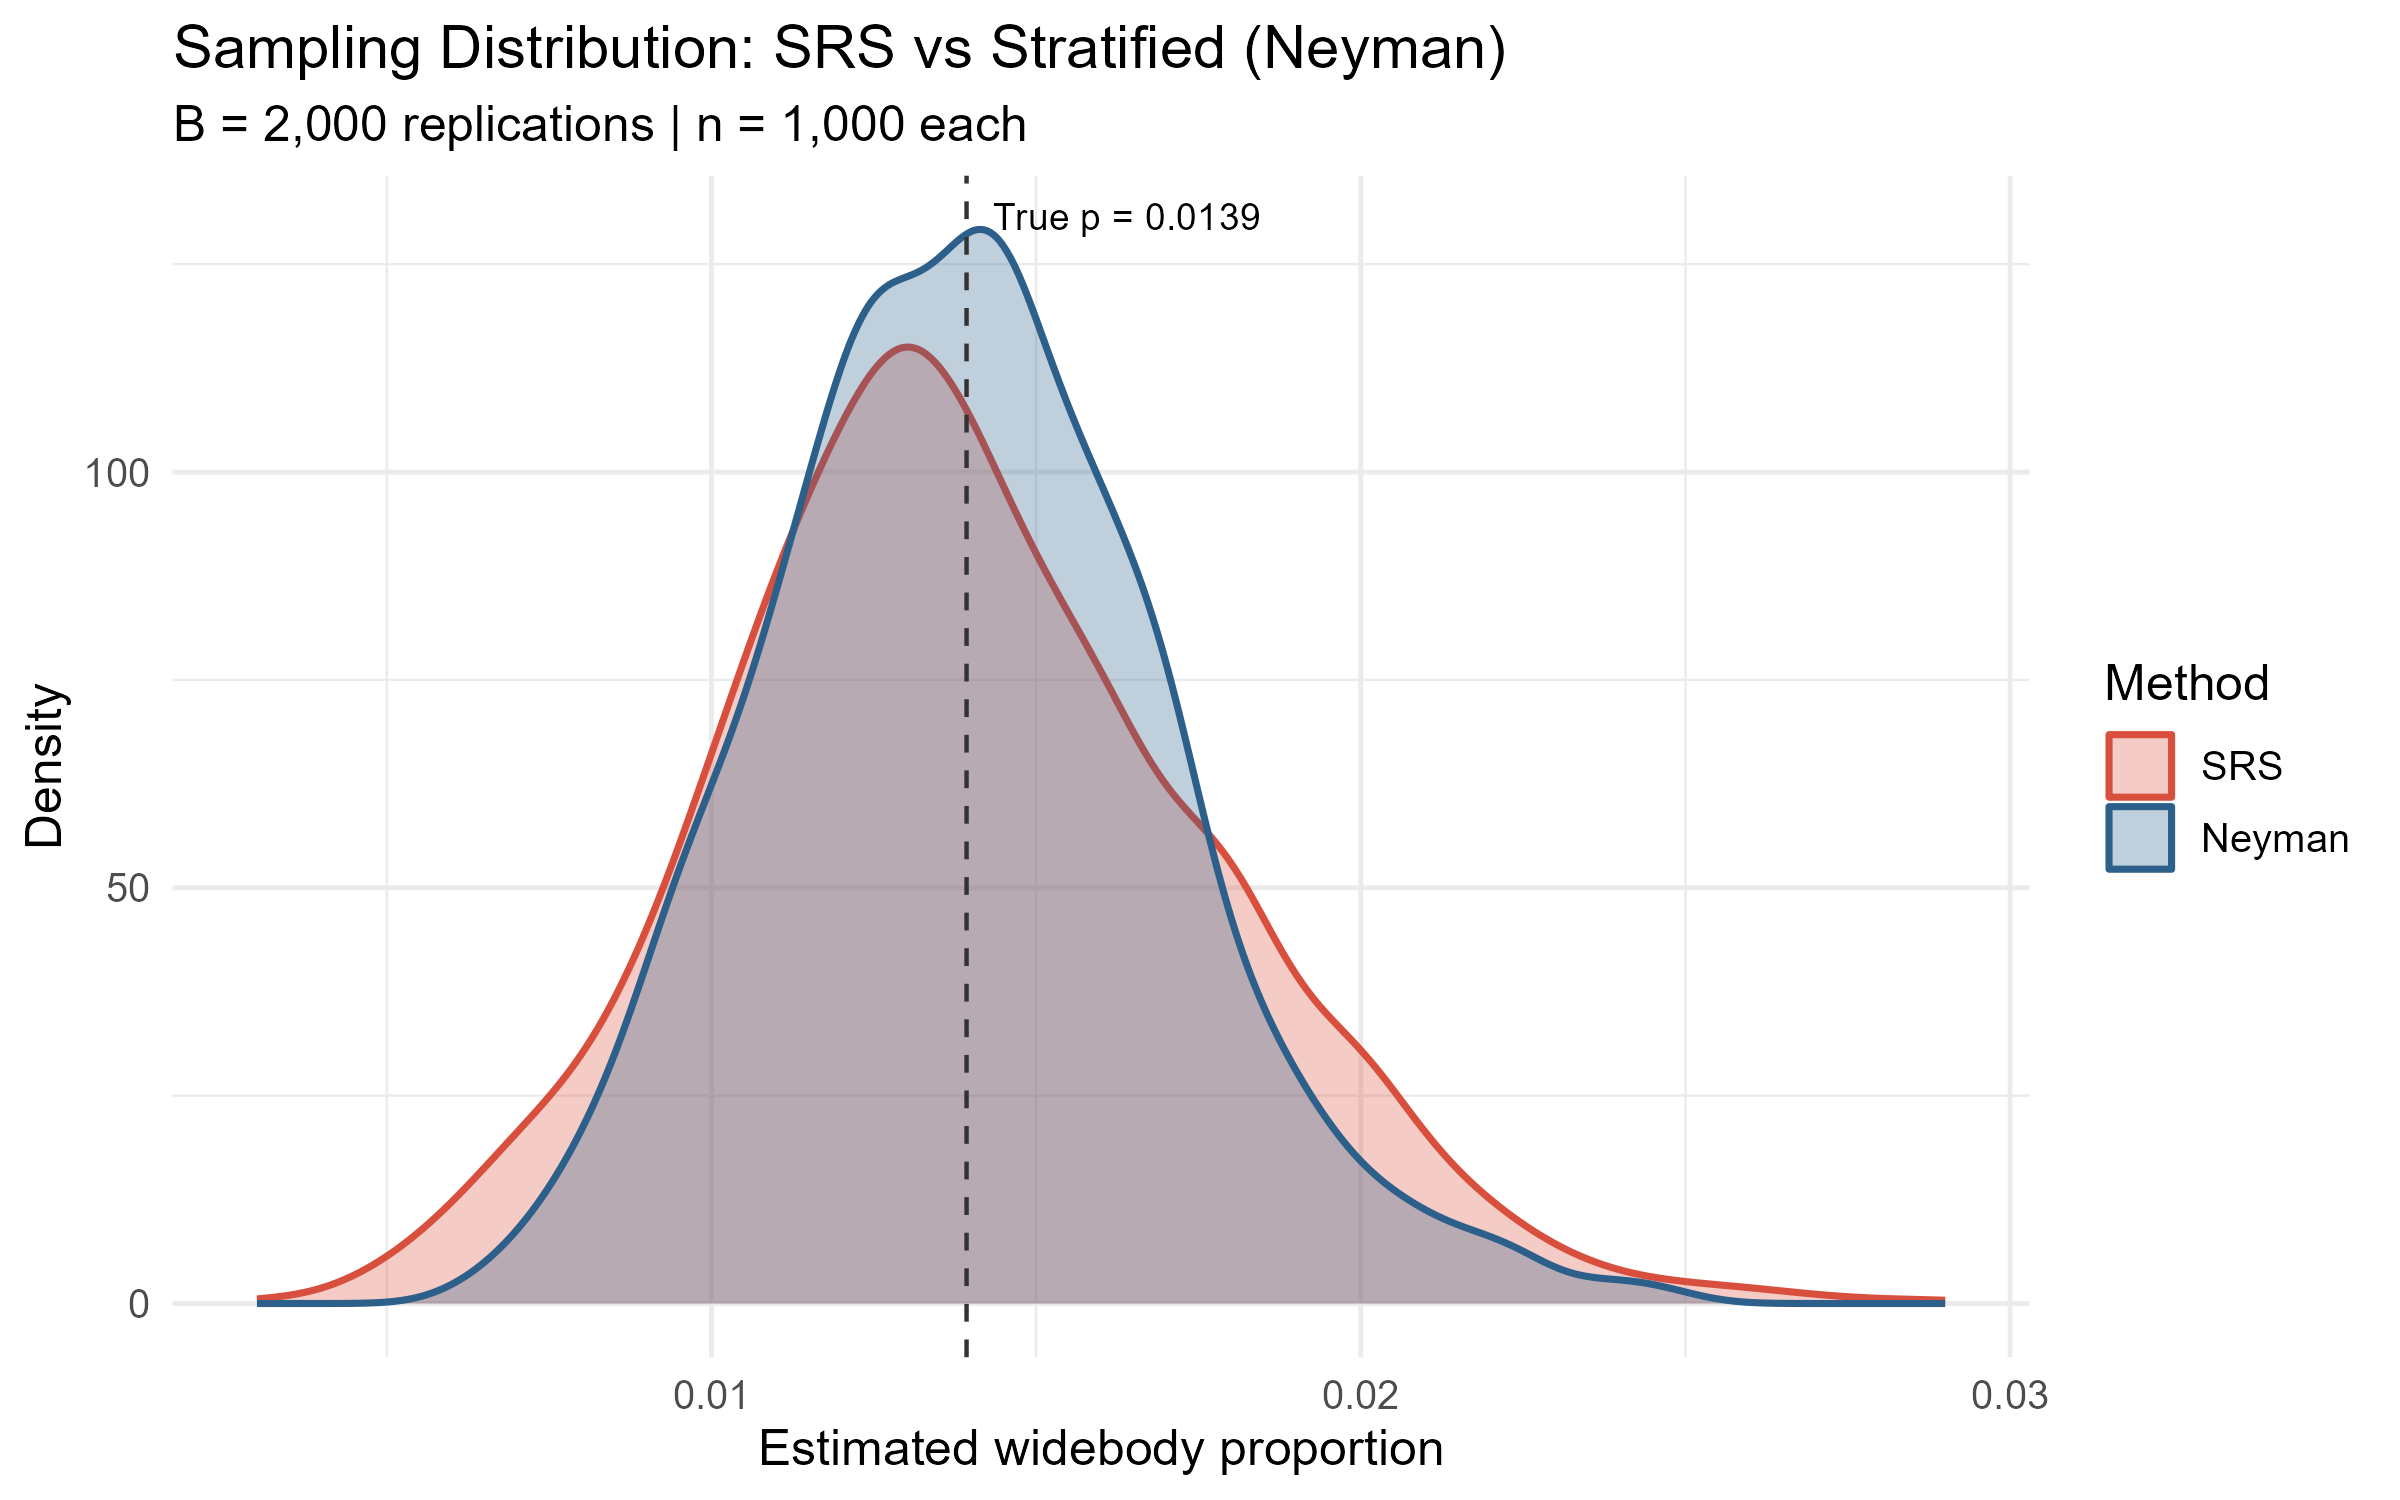
The study compares simple random sampling with two methods that sample within each distance band. Proportional allocation follows each band’s size. Neyman allocation also considers variability, putting more observations where they provide more information.
Each method uses 1,000 records. Across 2,000 repeated samples, Neyman allocation reduced estimation variance by approximately 33% compared with simple random sampling.
The repository includes data-cleaning scripts, plots, and simulation results. The full report explains the methods and findings.